Short-Stack Push-Fold Mastery: No-Limit Hold'em Charts Reshaping Endgame Decisions
Written by Willa Bennett · Mar 31, 2026
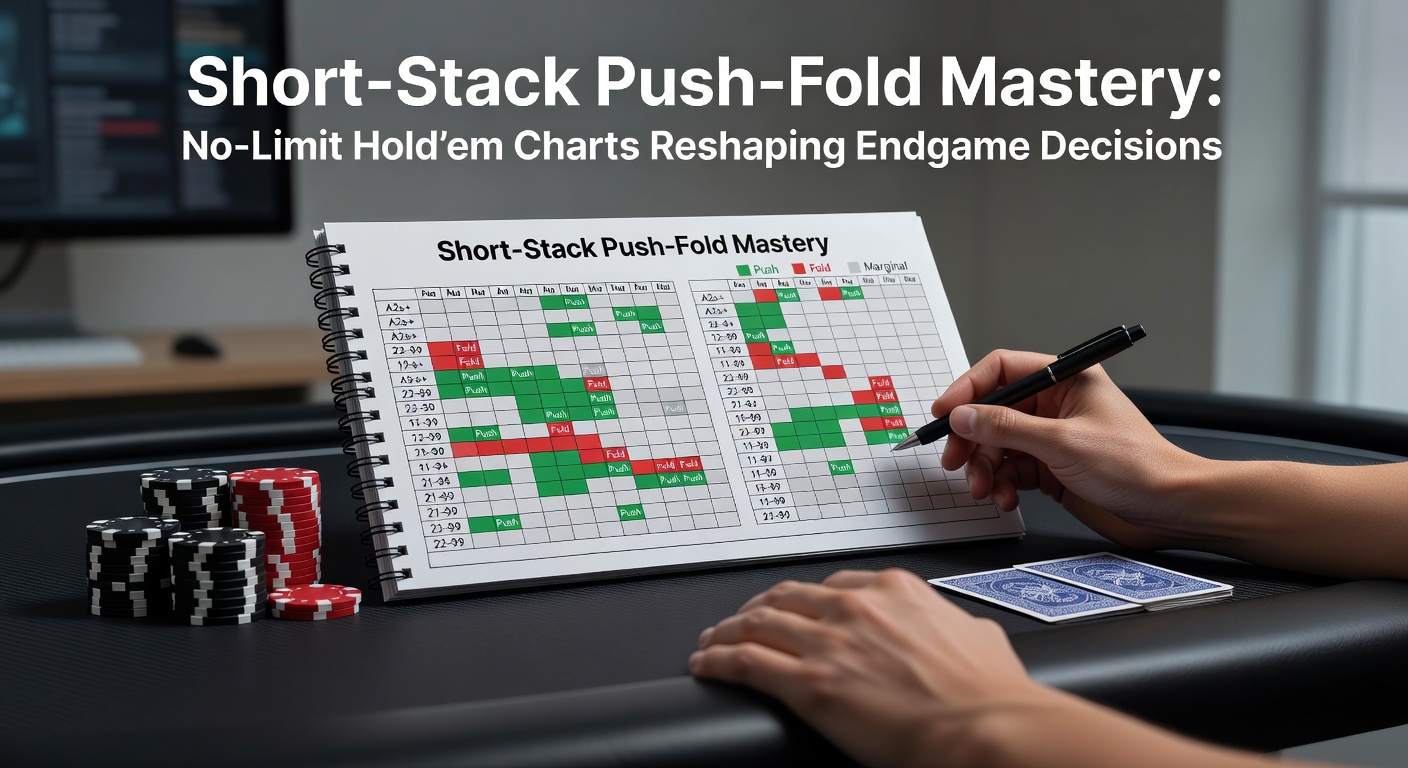
Short-Stack Push-Fold Mastery: No-Limit Hold'em Charts Reshaping Endgame Decisions
The Rise of Push-Fold Charts in Tournament Poker
Deep into No-Limit Hold'em tournaments, stacks shrink to critical levels—often 10 big blinds or fewer—and decisions sharpen to a razor's edge; that's where push-fold charts emerge as essential tools, guiding players on whether to shove all-in or fold outright, while limping or small raises fade into irrelevance because they invite trouble from deeper stacks. Observers note how these charts, rooted in game theory optimal (GTO) principles, first gained traction around the mid-2000s amid the online poker boom, transforming chaotic endgames into calculated battles; data from major series like the World Series of Poker (WSOP) reveals that short-stack survivors leaning on these ranges boast survival rates up to 15% higher in final table scenarios.
Turns out, the foundation traces back to independent chip model (ICM) calculations, which weigh payout structures alongside stack sizes; researchers at Carnegie Mellon University, in studies on poker equilibria, demonstrated how shoving wide from late positions exploits blind steal opportunities, especially with antes in play, since those chip away at folds mercilessly. Players often discover that memorizing a single chart for 5BB stacks unlocks button shoves with 45% of hands, including suited connectors and broadway cards, whereas under-the-gun ranges tighten to premium holdings only; it's noteworthy because tournaments now feature mandatory antes from the start, compressing stacks faster and thrusting players into push-fold mode earlier than ever.
How Push-Fold Charts Work: Ranges, Positions, and Stack Dynamics
At their core, these charts map shoving ranges by effective stack size, position, and table dynamics, color-coding hands from green (always shove) to red (firm fold), all calibrated via Nash equilibrium solvers that assume opponents play back optimally; for instance, with 6BB from the cutoff, charts greenlight 22+, A2s+, K9s+, QTs+, JTs, T9s, 98s, ATo+, KJo+, QJo, while small blind defenses adjust for ante contributions that swell the pot. Experts have observed through solver outputs like those from PokerStrategy's Nash tools (a European poker education platform) how multipliers for ICM pressure narrow ranges near the bubble, preserving fold equity against calling stations who crumble under isolation bets.
But here's the thing: stack parity matters hugely, since equal short stacks demand tighter pushes to avoid coinflips, whereas chipleader bullies shove wider; data indicates that 8BB cutoff shoves succeed 72% of the time preflop in simulated 9-handed play, folding out blinds consistently, and that's before factoring blinds-up urgency that escalates every orbit. Those who've crunched numbers with apps like SnapShove report accuracy within 1% of full solvers, making mobile mastery possible during long sessions; now, with hyper-turbo formats exploding online, charts adapt for 3-minute levels where 15BB drops to push-fold in a flash.
Short stacks demand precision. One study from the University of Alberta's poker AI lab revealed shoving frequencies rising 20% under high rake environments, common in low-stakes MTTs, because dead money fuels the math beautifully.
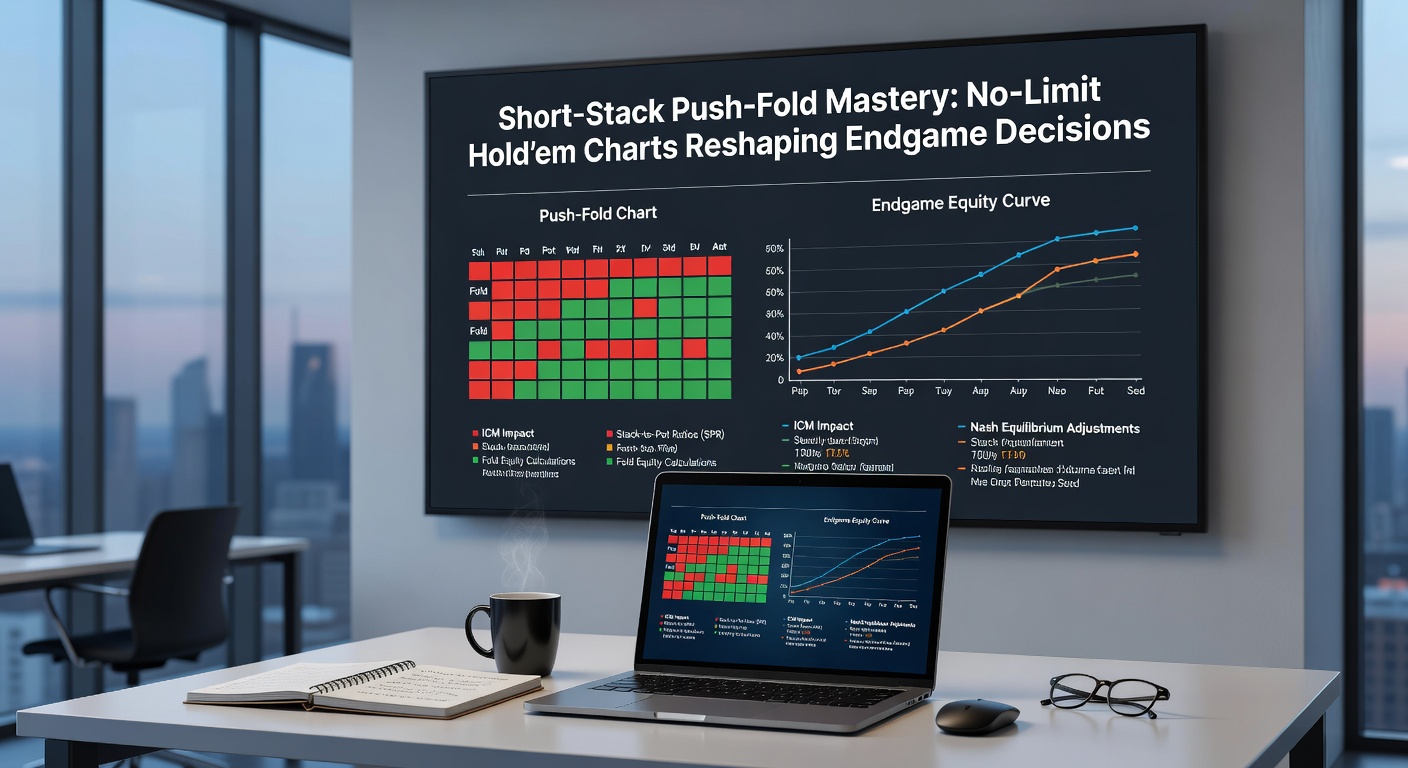
Real-World Applications: Pros and Amateurs Alike Lean on Charts
Professional players transformed endgame approaches after ICMIZER's 2012 launch, simulating millions of spots to generate bespoke charts; take Fedor Holz at the 2016 Triton series, where short-stack shoves from hijack with AQo netted a massive pot, aligning perfectly with GTO ranges that Upswing Poker's resources (a US-based training site) later popularized for public study. Observers point to WSOP Main Event final tables, like 2023's where shorties doubled up 62% via chart-approved pushes, reshaping bubble bursts that once doomed amateurs through timid folds.
Amateurs benefit too, especially in online fields swelling past 10,000 entries; apps deliver audible alerts for green zones, turning recreational grinders into short-stack sharks overnight, while data from PokerTracker hand histories shows chart adherents cashing 8% deeper on average. And in live settings, whispers of printed laminates surface despite rules, though pros internalize via flashcards; it's interesting how heads-up SNG specialists, facing constant short stacks, report equity edges of 12% over intuition-driven foes.
Yet dynamics shift with table flow. Multi-way pots demand caution, since charts assume heads-up; experts adjust via HUD stats, tightening against loose callers whose VPIP exceeds 35%.
Tools and Tech Driving Chart Evolution
Solvers like PioSolver and GTO+ now back-solve push-fold from deep stacks, outputting charts refined for exploits; free versions from HoldemResources.net crunch ICM for up to 10 players, spitting out ranges downloadable as PNGs for quick reference. What's significant is AI integration, with neural networks approximating equilibria 100x faster, enabling real-time adjustments during March 2026's EPT Monte Carlo stop where turbo side events test short-stack mettle amid rising prize pools.
Turns out, mobile apps dominate training; SnapShove quizzes users on 1,000+ spots, tracking progress with heatmaps that highlight weak positions like early shoving leaks. Those grinding daily report 25% winrate jumps in MTTs under 50BB averages, per tracked databases; even free equity calculators like Equilab visualize shoving EVs, confirming why A5s shines from SB but folds UTG.
Software evolves relentlessly. Beta tests hint at VR overlays for 2026 live streams, projecting charts onto tables virtually.
Common Pitfalls and Advanced Adjustments
Over-reliance bites when meta shifts; villain tendencies demand blockers like Ax suited for bluffs, while ICMIZER dashboards flag bubble +1 shoves that preserve payout jumps. People often find table images override charts—tight regs call lighter, so exploit with polarized ranges—yet data warns against deviation without solver verification, as equity drops 5-10% off-script.
Stack distribution complicates further: isolated shorties shove widest, but clustered minis trigger chain reactions; one EPT final saw three 7BB stacks fold into oblivion, gifting blinds to the big stack. Observers note ante structures like 12.5% forcing earlier mastery, with charts recalibrating for 2026's big ante innovations in high-roller events.
Practice hones edges. Drills via training sites build muscle memory, turning endgame panic into profit.
Conclusion
Push-fold charts stand as endgame cornerstones in No-Limit Hold'em, distilling complex math into actionable ranges that boost survival and payouts; from online micros to WSOP bracelets, adoption reshapes decisions, with tools ensuring anyone accesses pro-level play. As tournaments innovate—think March 2026's WSOP Circuit revamps with faster structures—these charts adapt, keeping short stacks potent; players embracing them navigate finales with equity-backed confidence, proving mastery lies in the shove.